The Divided States of America
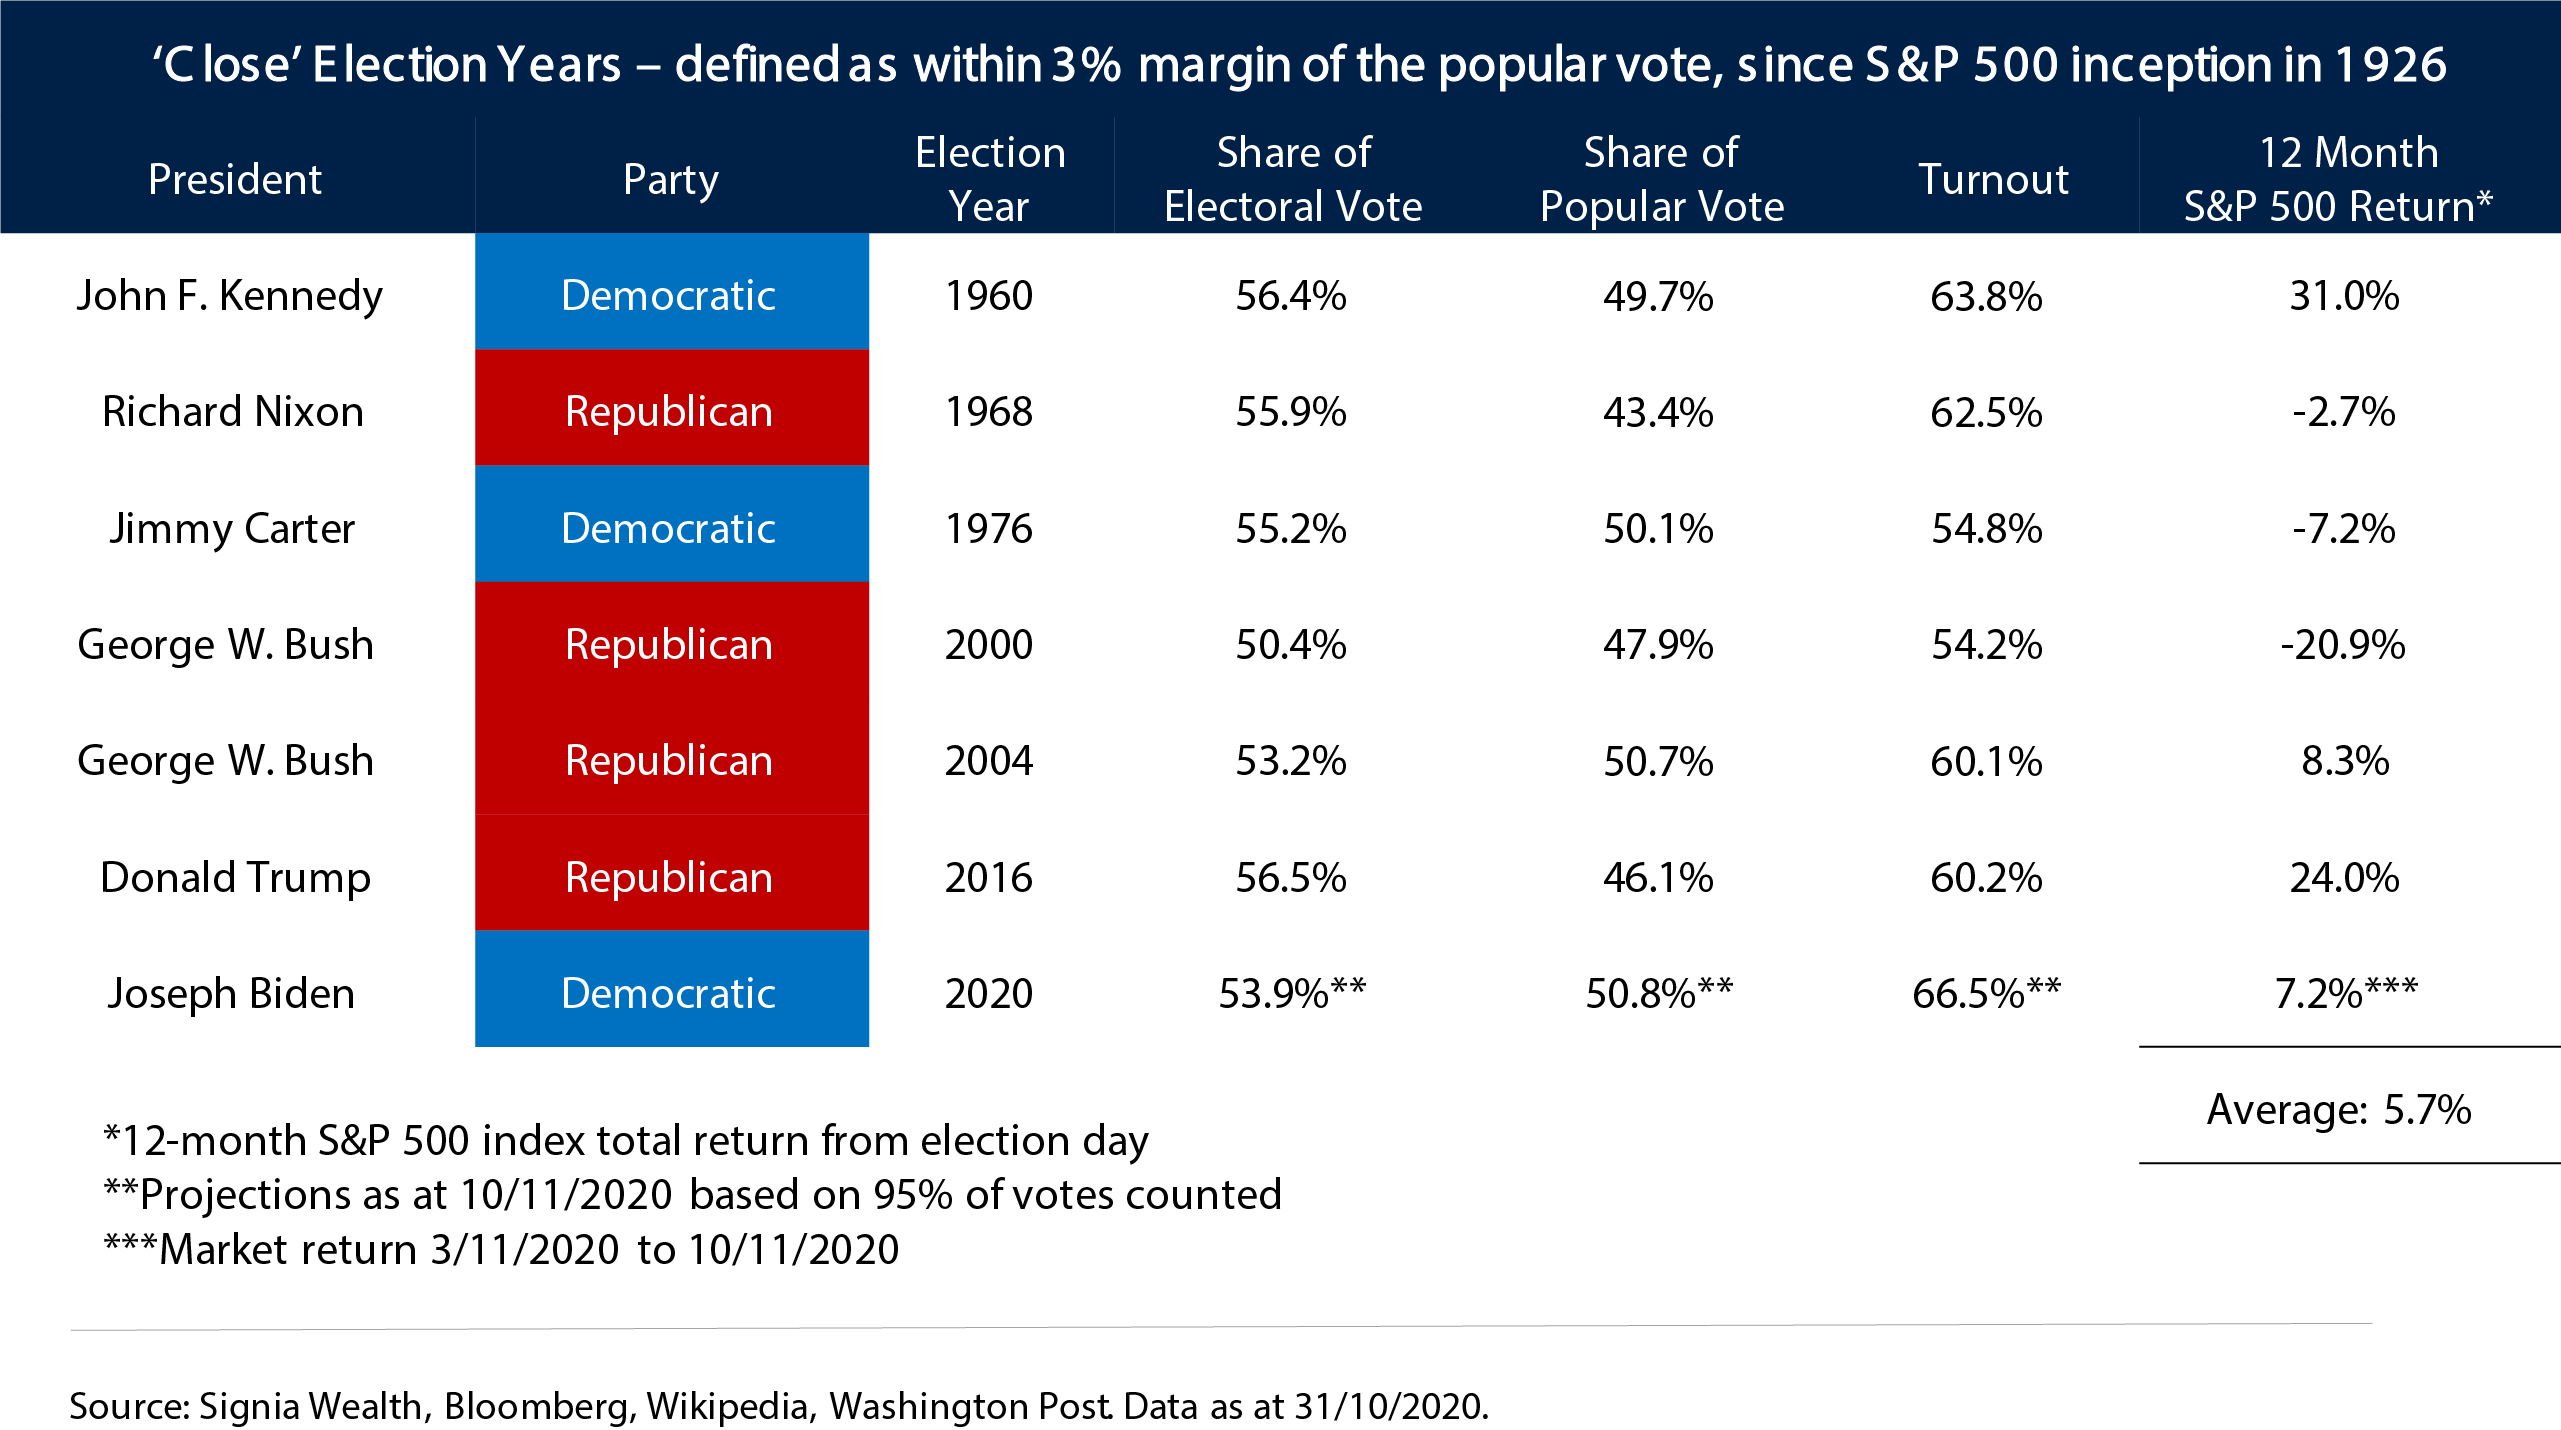
On Tuesday 8 November 1960, during the closest American election in recent history, John F. Kennedy won the popular vote by less than 120,000 votes out of 68.8 million votes cast to receive 303 electoral college votes to Richard Nixon’s 219. Nixon officially conceded the following day by telling his friend and journalist, Earl Mazo, that “our country cannot afford the agony of a constitutional crisis”.
Not wanting to damage his future political career (ironically he did so 12 years later with the Watergate scandal) he made the ultimate sacrifice, Nixon refused to ask for a recount. Of course there were no postal votes to deal with at this time, but in later years in an autobiography he claimed that widespread fraud happened in Illinois and Texas which cost him the 1960 election.
This year’s election will unquestionably be remembered in the history books as another close and controversial one. It’s set to be the tightest US election in 20 years since George W. Bush edged past Al Gore to the White House with a margin of only half a million popular votes and 50.4% share of electoral votes. The 2020 election has produced the highest voter turnout since 1900, currently projected to be 66.5%, and has seen the highest number of early votes cast in history with over 100 million Americans participating before election day.
Joe Biden is set to win the most popular votes than any other candidate in history, taking 77 million votes versus 72 million votes for Donald Trump, which in turn will be the most votes ever won by a Republican candidate. Trump will be the first one-term president in 30 years and the only one ever to lose the popular vote twice. This US election has indeed been remarkable and has lived up to the rollercoaster shock and awe levels that we have become accustomed to in 2020.
Equity market returns following closely contested elections throughout American history have been mixed, and usually influenced more by prevailing market and macroeconomic factors rather than new political policies and agendas. With the exception of Trump’s 2017 tax cuts, the big S&P 500 moves following the 1960 and 2000 elections were driven by a booming economy in 1961, the bursting of the 90’s tech bubble in the early 00’s, and the 9/11 terrorist attacks.
As things stand today, the 2020 post-election process looks set to be one of the most divisive and drawn out in history, with Donald Trump and some senior Republican party leaders alleging fraud, calling for a recount in Wisconsin, and filing lawsuits in Arizona, Georgia, Michigan, Nevada and Pennsylvania.


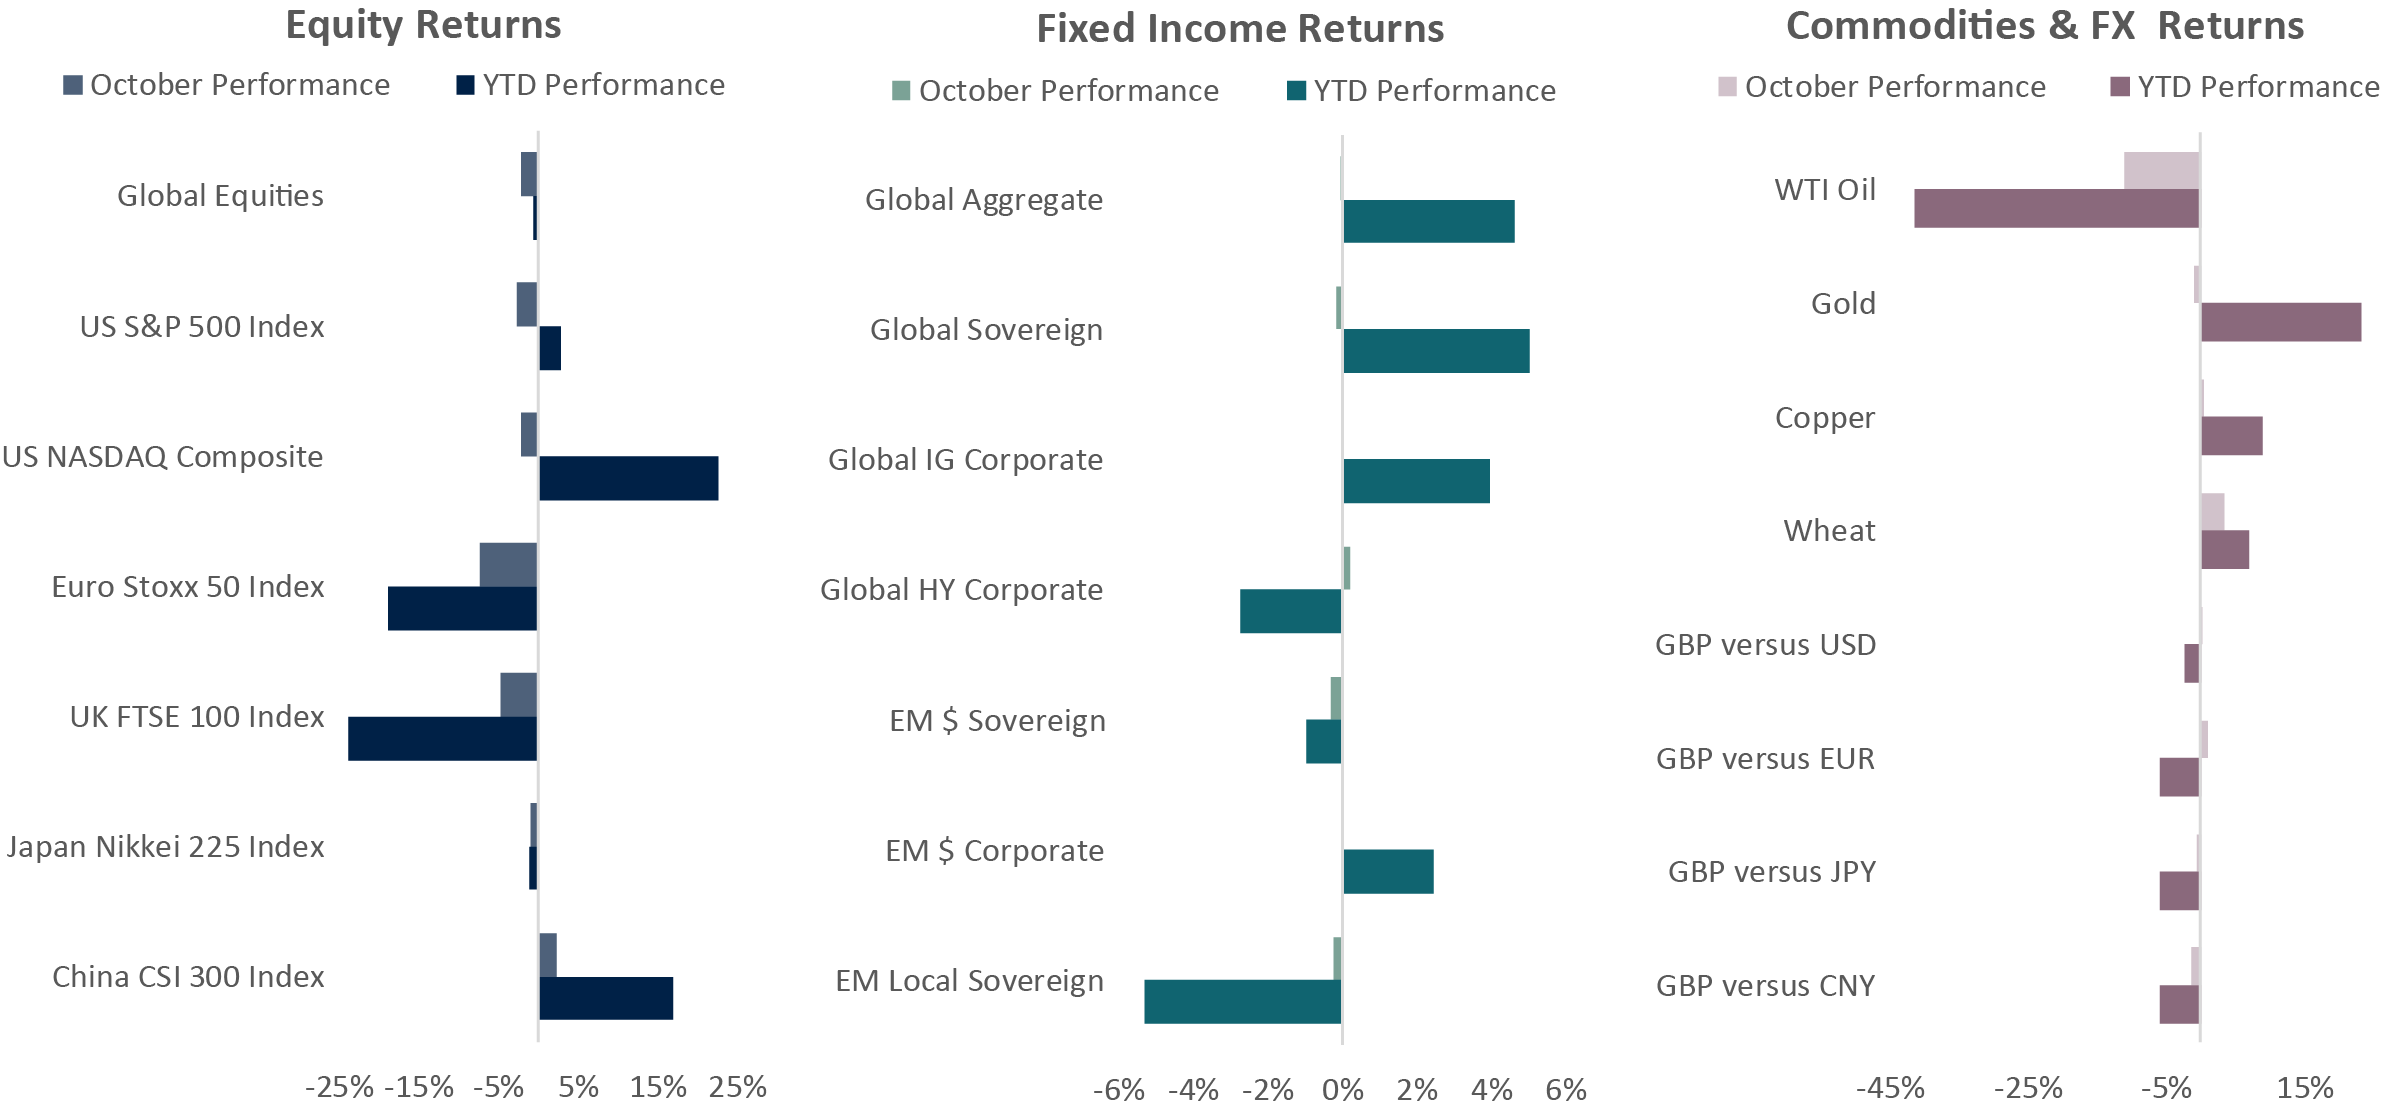
Source: Signia Wealth, Bloomberg. Data as at 31/10/2020. Global Equities: iShares MSCI ACWI ETF; Global Aggregate: Vanguard Global Bond Index GBP Hedged Fund; Global Sovereign: Xtrackers Global Government Bond GBP Hedged ETF; Global IG Corporate: Vanguard Global Corporate Bond Index GBP Hedged Fund; Global HY Corporate: iShares Global High Yield Corporate Bond GBP Hedged ETF; EM$ Sovereign: iShares J.P. Morgan USD EM Bond ETF; EM$ Corporate: iShares J.P. Morgan USD EM Corporate Bond ETF; EM Local Sovereign: iShares J.P. Morgan EM Local Government Bond ETF.
Equities
• European equities sold off sharply in October, as escalating coronavirus cases and subsequent economic lockdowns soured investor sentiment.
• UK and US bourses fared somewhat better but still ended the month down, with the latter also affected by political uncertainty.
• Asian equity indices outperformed their equity peers, with better control of coronavirus and improving economic data buoying investors.

Jack Rawcliffe
Fixed Income
• The global sovereign debt index was flat on the month as investors looked to safe-havens given the resurgence of Covid-19 cases across the globe and the re-instatement of lockdown measures across Europe.
• Global corporate credit finished the month slightly up in dollar hedged terms, benefitting from strong central bank support and investors’ search for yield.
• Emerging market debt was not spared from the risk-off sentiment with all three major EMD sub-indices ending the month in negative or flat territory, led by hard currency sovereigns as uncertainty around the US elections resulted in a ‘persistent flight to quality’.

Grégoire Sharma
Commodities & FX
• WTI Crude Oil continued its decline for the second month in a row, falling 11% as concerns surrounding demand and supply sustained following increased lockdowns globally and an upheave in production from Libya . The commodity is down over 41% for 2020.
• Volatility took hold, as Wall Streets fear gauge the “Vix” rose over 44% as virus and election uncertainty took focus. Whilst Gold’s “safe haven” status was tested as a result of a rising US Dollar and muted inflation expectations.

Harry Elliman

Choose a Service to Invest through
United States of America
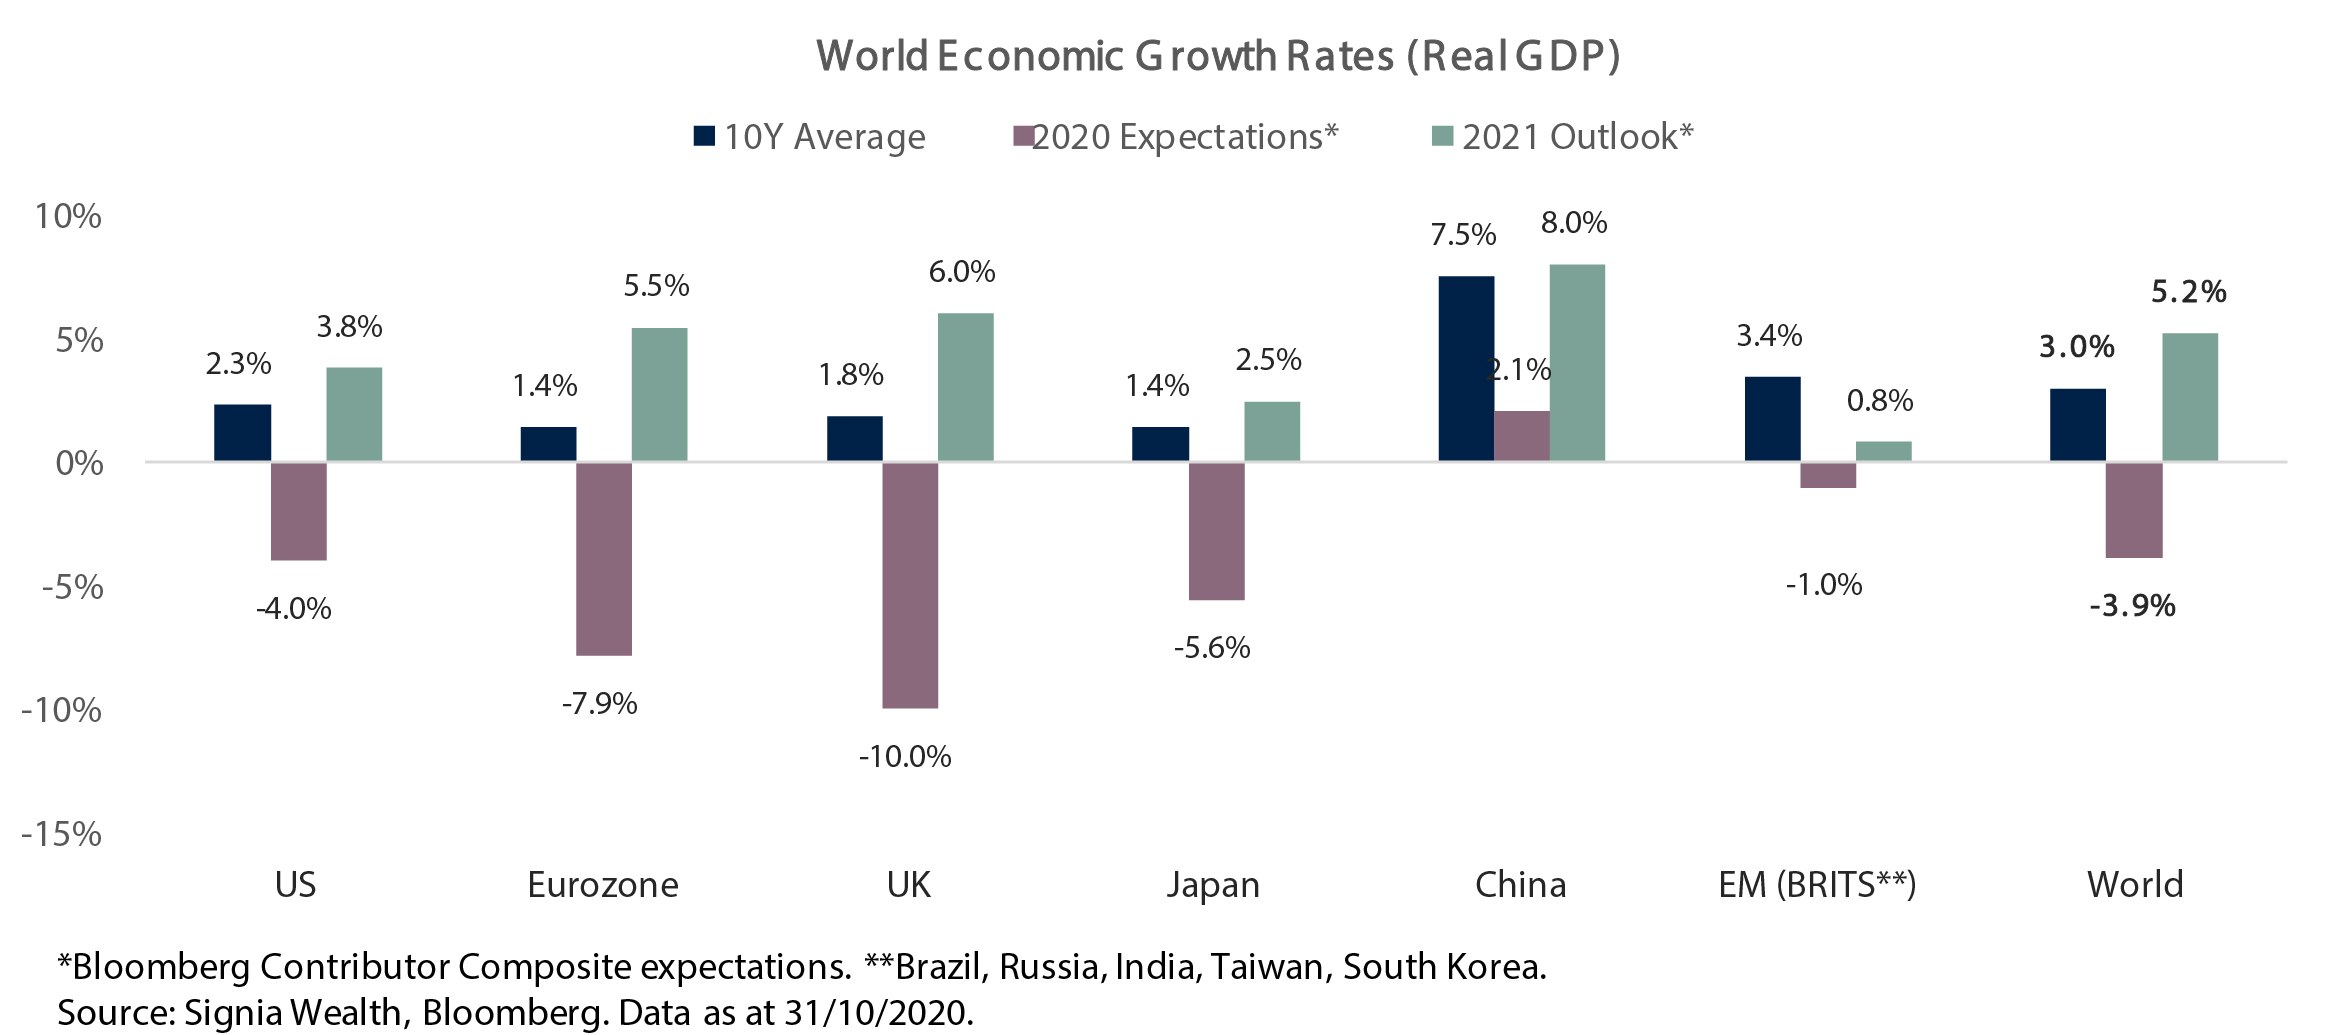
The US economy has rebounded quicker and stronger than expected over the summer after the shortest sharpest recession in history, which saw the economy contract -10.4% in nominal terms during the first half of 2020. However, coronavirus infections remain high, political risk is elevated, and congress remains divided on further fiscal stimulus measures to help main street where small businesses are struggling.
Eurozone
Europe has experienced a deeper economic recession this year versus other regional economies and deflation risk is a real concern with consumer prices declining -0.3% year-on-year in October. Second economic lockdowns are now being implemented across Germany, France and other Eurozone nations and are further pressuring inflation expectations, However, with the European Recovery Plan now agreed amongst member states and additional ECB stimulus on the way in December, expectations for higher economic growth in 2021 and beyond are rising.
United Kingdom
The UK suffered a worse economic and humanitarian fate relative to the Eurozone after being slower to introduce coronavirus containment measures that were amongst the strictest in Europe. With November’s Lockdown 2.0 now finished and a return to stricter local tiered restrictions in place to counter still persistently high daily infection rates, an economic contraction in Q4 looks increasingly possible alongside a no-deal Brexit at the end of the year.
Japan
In his first months of leadership Prime Minister Suga has so far successfully navigated his country through the ongoing pandemic, avoiding any runaway second wave of infections in Japan in contrast to many of its northern hemisphere winter counterparts. Domestic economic growth indicators for 2020 are also outpacing most G10 counterparts, however with many structural issues in Japan persisting, namely demographic, the economic bounce for the Japanese economy next year is still expected to be relatively modest.
China
China is one of very few global economies that has avoided an economic recession this year by growing an impressive 4.9% year-on-year in the third quarter after quickly returning economic operating capacity back to pre-pandemic levels. Chinese GDP is expected to continue its solid growth path and rebound to its long-term historical growth rate of 8% in 2021. China’s recently announced new five-year economic plan elevates its self-reliance in technology into a national strategic pillar, most likely as a direct result of growing competitive tensions and trade wars with the US.
Emerging Markets
Emerging economies, mostly outside of Asia, are still feeling the full economic and humanitarian impact from the coronavirus crisis. Economic performance has been mixed this year with commodity producers Brazil and Russia suffering from a collapse in prices, India as a net importer of commodities benefitting from price declines but suffering badly from a protracted and damaging first wave on infections; and Taiwan and South Korea feeling less economic pain due to successful virus containment measures and buoyant trade tailwinds with China.
Important Information
The information set out in this document has been provided for information purposes only and should not be construed as any type of solicitation, offer, or recommendation to acquire or dispose of any investment, engage in any transaction or make use of the services of Signia. Information about prior performance, while a useful tool in evaluating Signia’s investment activities is not indicative of future results and there can be no assurance that Signia will generate results comparable to those previously achieved. Any targeted returns set out in this document are provided as an indicator as to how your investments will be managed by Signia and are not intended to be viewed as a representation of likely performance returns. There can be no assurance that targeted returns will be realised. An estimate of the potential return from an investment is not a guarantee as to the quality of the investment or a representation as to the adequacy of the methodology for estimating returns. The information and opinions enclosed are subject to change without notice and should not be construed as research. No responsibility is accepted to any person for the consequences of any person placing reliance on the content of this document for any purpose. No action has been taken to permit the distribution of this document in any jurisdiction where any such action is required. Such distribution may be restricted in certain jurisdictions and, accordingly, this document does not constitute, and may not be used for the purposes of, an offer or solicitation to any person in any jurisdiction were such offer or solicitation is unlawful. Signia Wealth is authorised and regulated by the Financial Conduct Authority.

