Taking stock on the anniversary of the pandemic market trough
The first quarter of 2021 marked the 12-month anniversary of the covid-19 pandemic, but this year it was full of drama on the other side of the risk spectrum. We saw retail investors drive some share prices and equity indices to all-time highs, major flows into thematic ETFs, and numerous examples of excess liquidity in the global financial ecosystem (record SPAC announcements and M&A levels). There was also no let up in the reflation theme, which has been a key driver behind market returns since the positive Pfizer/BioNTech vaccine announcement and Biden election win in November last year, with small cap, value and cyclical stocks all outperforming strongly. In fact, the broader risk market recovery had been gaining momentum over the summer since its pandemic trough on 23 March 2020, and only as the global economy was showing tentative signs of stabilisation, let alone a strong recovery to match forward-looking financial market pricing. Indeed, any investor that believed in this key thematic equation over the last 12 months should be in a better position today:
Virus + Vaccine = V-Shaped Recovery
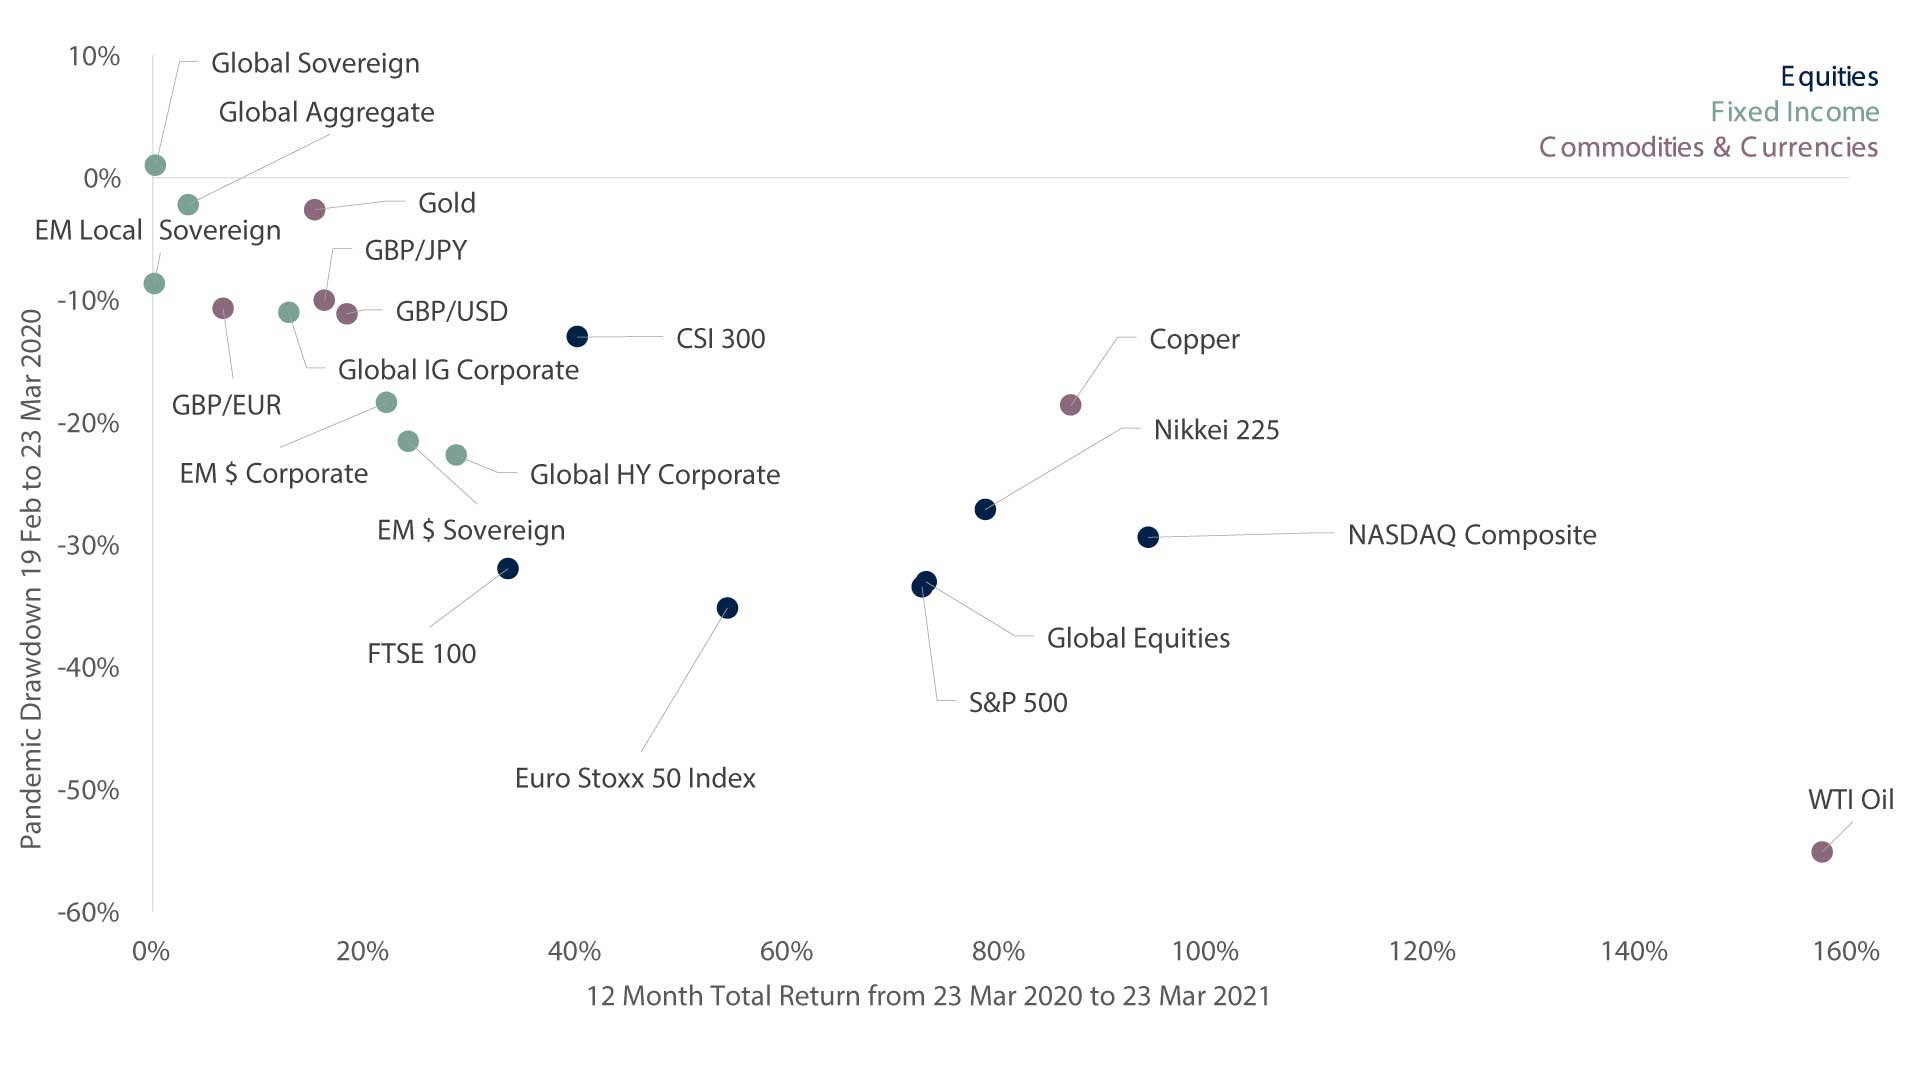
Overall, after a sharp drawdown of -32% between 19 February 2020 and 23 March 2020, the MSCI All Country World Equity Index is now 72% above its March low and 16% higher than its February peak. Consensus earnings expectations over then next 12 months for these global companies is now back at pre-pandemic levels, leaving the index on an elevated valuation not seen since the late 90’s tech bubble. However, arguably this is justified as we are early in the economic and earnings cycles with easer financial conditions, and with an expanding U.S. fiscal stimulus boost over coming years and trillions of dollars in pent-up savings ready to be spent, the world economy is poised for the fastest expansion on record since the 1960s to match the V-shaped market recovery over the last 12 months.
It’s safe to say that the Coronavirus Crisis and what subsequently unfolded over the last year has surprised everyone, first on the downside then on the upside, but what has been exceptionally unsurprising has been how the top 20 global financial markets that we track have behaved and reacted to this stress test. Safe haven sovereign bonds and to a lesser extent gold, provided scarce capital protection during the drawdown, whilst equity markets and cyclical commodities such as oil and copper suffered the most. Another historically consistent example of the elasticity of global financial markets and the importance of a well diversified multi-asset portfolio.


Source: Signia Wealth, Bloomberg. Data as at 31/03/2021. Global Equities: iShares MSCI ACWI ETF; Global Aggregate: Vanguard Global Bond Index GBP Hedged Fund; Global Sovereign: Xtrackers Global Government Bond GBP Hedged ETF; Global IG Corporate: Vanguard Global Corporate Bond Index GBP Hedged Fund; Global HY Corporate: iShares Global High Yield Corporate Bond GBP Hedged ETF; EM$ Sovereign: iShares J.P. Morgan USD EM Bond ETF; EM$ Corporate: iShares J.P. Morgan USD EM Corporate Bond ETF; EM Local Sovereign: iShares J.P. Morgan EM Local Government Bond ETF.
Equities
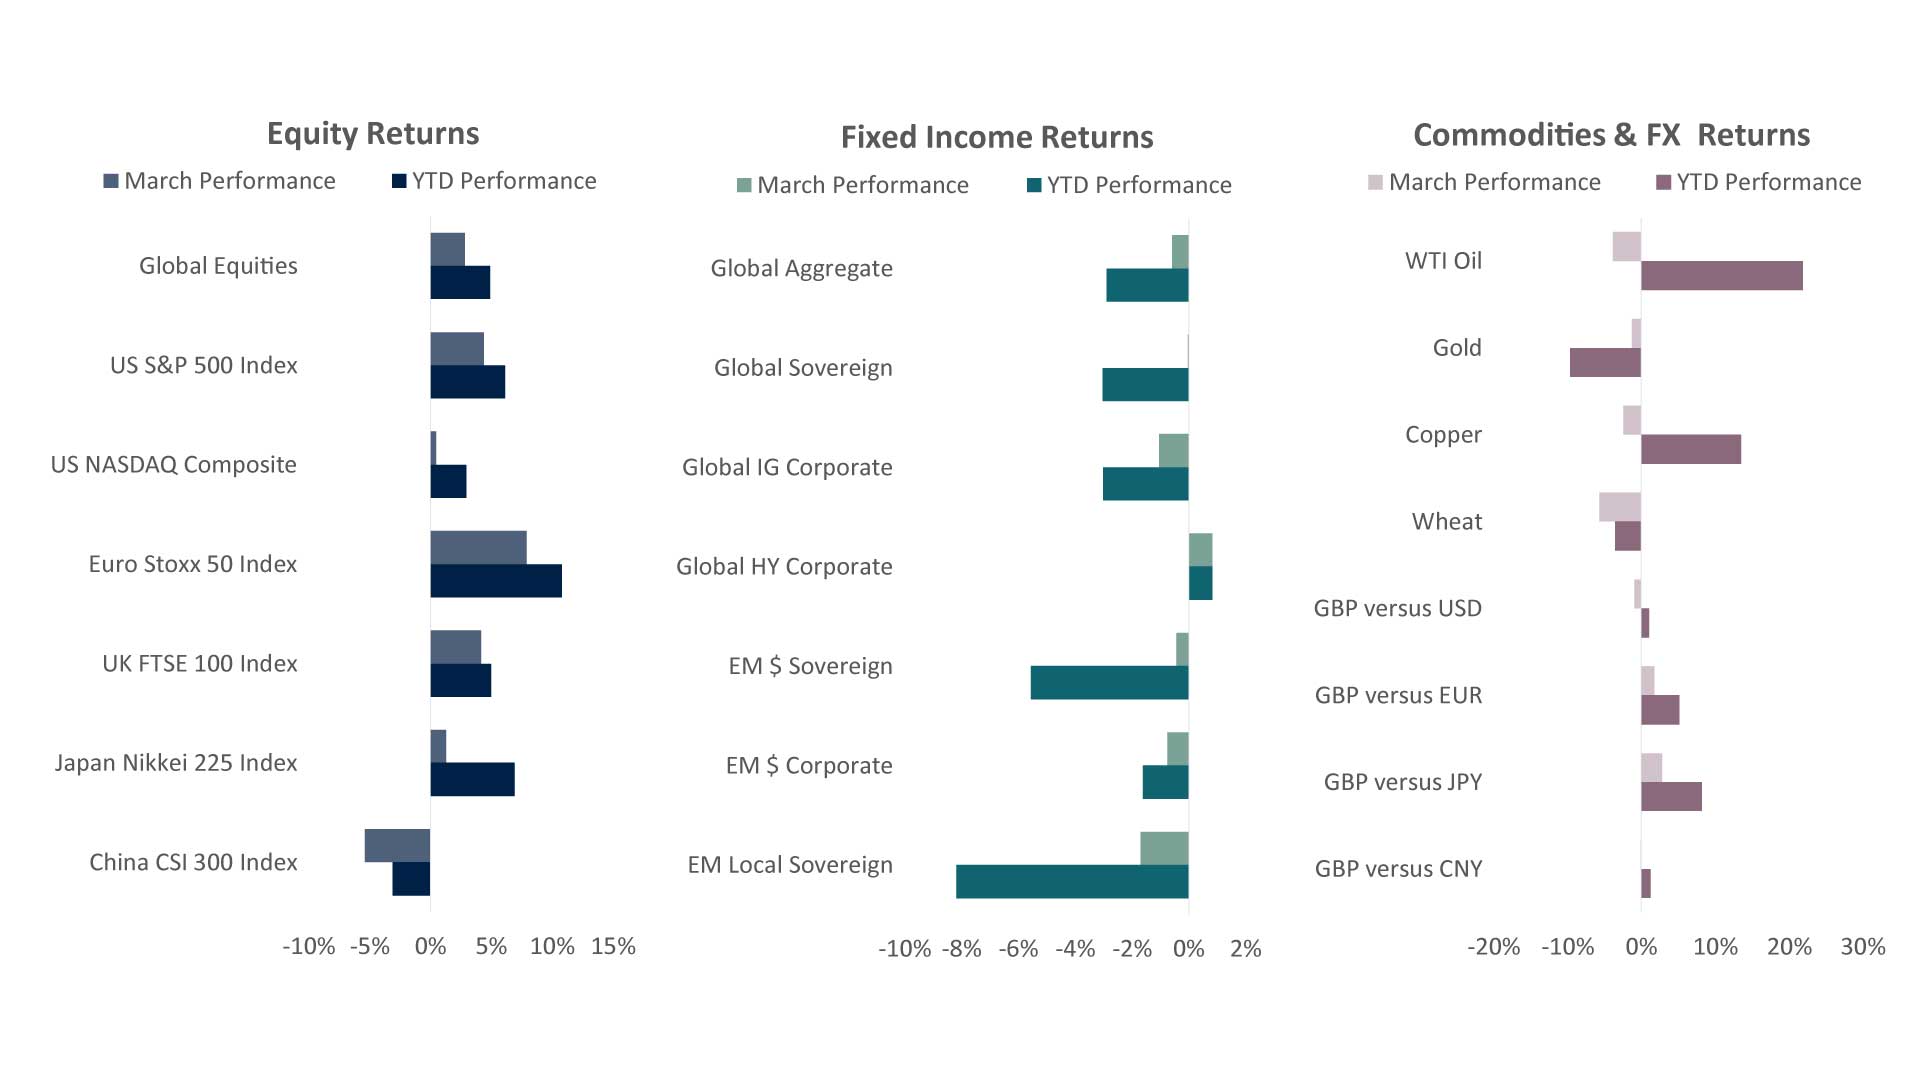
• European equities delivered the best performance during March, as their higher cyclical content and cheaper valuations outweighed concerns around renewed coronavirus lockdowns.
• Headline US equities achieved a decent positive return for the month, however stocks in the technology sector again underperformed due to their sensitivity to rising bond yields.
• UK and Japanese markets also posted positive returns, however Chinese equities were negative due to a mixture of risk-off sentiment, profit-taking, and concerns surrounding the Chinese economic recovery.

Jack Rawcliffe
Fixed Income
• The Global Aggregate index was down this month as investors worried that the size of the US stimulus combined with pent-up savings could lead to a pickup in inflation, potentially leading the FED to tighten policy earlier than expected.
• It was a mixed month in Global Credit with Investment Grade Credit down on the month, underperforming High Yield Credit due to the longer interest rate sensitivity of the former. The latter, posting slight positive returns, also benefitted from investors’ continued hunt for yield.
• Emerging Market Local Sovereign Debt suffered the most as rising US bond yields and a strengthening US dollar on the month led to both weaker investor sentiment and negative returns for EM currencies.

Grégoire Sharma
Commodities & FX
• Gold fell 1.5% on the backdrop of a rising US Dollar & steeping in the US yield curve. Gold is yet to post a positive monthly gain in 2021, and is down 10% for the year.
• The “Reflation” trade took a breather in March as both WTI Crude oil & Industrial Metals fell -3.8% and -2.1%respectively. Optimism surrounding the global economy re-opening moderated due to concerns surrounding new Covid-Variants and pace of vaccinations. Despite this, the bias is still towards a robust global recovery.

Harry Elliman
World Economic Growth Rates (Real GDP)

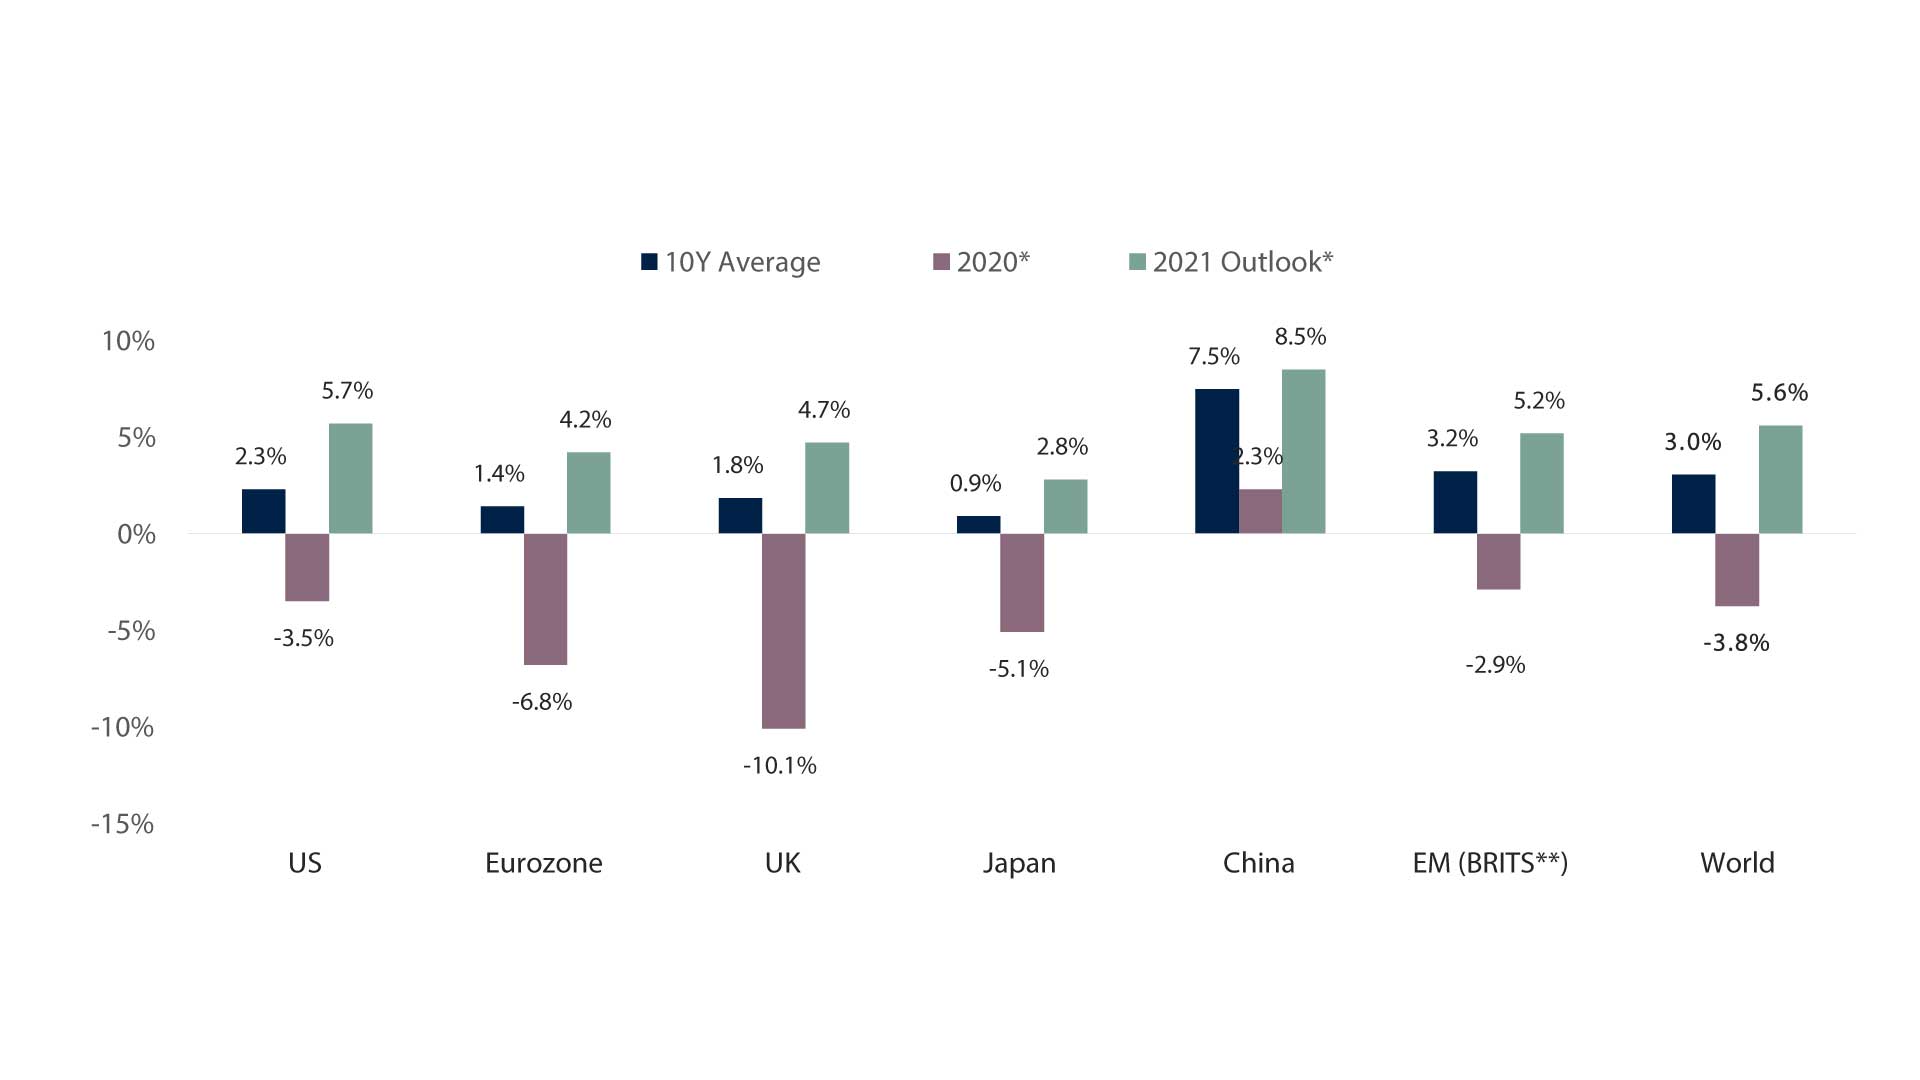
*Bloomberg Contributor Composite expectations. **Brazil, Russia, India, Taiwan, South Korea. Source: Signia Wealth, Bloomberg, IMF. Data as at 31/03/2021.
Choose a Service to Invest through
United States of America
The US economy is expected to grow in 2021 at its fastest pace since the 1980s as the country’s vaccination programme progresses quickly and economic restrictions are lifted, pent-up consumer demand and rising economic sentiment from record levels of savings boost consumption, and fiscal impulse from Biden’s multiple trillion-dollar fiscal packages are deployed.
Eurozone
Europe is still struggling with slow vaccine rollout progress and rising covid-19 infection rates that are keeping economic lockdowns in place. However, with funds from the recently approved European Recovery Plan due for distribution to EU member states this year, and continued ECB stimulus support via the Pandemic Emergency Purchase Programme (PEPP), hopes for higher economic growth in the second half of 2021 and beyond persist.
United Kingdom
This British winter has seen stricter national lockdowns reminiscent of the initial Spring 2020 lockdown, but households have used this time and government furlough schemes to strengthen their finances and become net savers in anticipation of a Spring 2021 unlocking following a successful vaccine rollout programme to date. Economic activity is expected to rebound very strongly in the second quarter and markets are now pricing in two bank of England rate hikes by the end of 2023, as opposed to zero at the start of the year.
Japan
Japan is struggling to control a third and prolonged coronavirus wave that is significantly worse than its spring and late summer waves, which saw the country declare a state of emergency. Japan has been one of the last G20 countries to start its vaccination programme as it waited for testing results from trials on its own domestic population. Despite substantial policy support, a vaccine-sceptic population may hamper a significant economic rebound in 2021.
China
China was one of only two global economies that avoided an economic recession in 2020 and has already expanded its output beyond pre-pandemic (the other country being Taiwan). Chinese GDP growth is expected to continue its solid path and rebound above its long-term historical growth rate to 8.5% this year. China’s new five-year economic plan elevates its self-reliance in technology into a national strategic pillar, most likely as a direct result of growing competitive tensions and trade wars with the US.
Emerging Markets
Emerging economies have found themselves lagging the global vaccine rollout programme with only 1% of the poorest EM populations currently vaccinated. Despite the outlook for a more synchronised global growth backdrop in 2021 as broad economic momentum gathers pace and reflation policies takes hold, key economies in Brazil, India, Russia and Turkey are fighting elevated and worsening covid-19 infection rates.
Important Information
The information set out in this document has been provided for information purposes only and should not be construed as any type of solicitation, offer, or recommendation to acquire or dispose of any investment, engage in any transaction or make use of the services of Signia. Information about prior performance, while a useful tool in evaluating Signia’s investment activities is not indicative of future results and there can be no assurance that Signia will generate results comparable to those previously achieved. Any targeted returns set out in this document are provided as an indicator as to how your investments will be managed by Signia and are not intended to be viewed as a representation of likely performance returns. There can be no assurance that targeted returns will be realised. An estimate of the potential return from an investment is not a guarantee as to the quality of the investment or a representation as to the adequacy of the methodology for estimating returns. The information and opinions enclosed are subject to change without notice and should not be construed as research. No responsibility is accepted to any person for the consequences of any person placing reliance on the content of this document for any purpose. No action has been taken to permit the distribution of this document in any jurisdiction where any such action is required. Such distribution may be restricted in certain jurisdictions and, accordingly, this document does not constitute, and may not be used for the purposes of, an offer or solicitation to any person in any jurisdiction were such offer or solicitation is unlawful. Signia Wealth is authorised and regulated by the Financial Conduct Authority.

