Rising bond yields and shaky equity markets… 2018 déjà vu?
There is plenty to be optimistic about these days. Global covid vaccination programmes are well underway, many countries are exiting their winter lockdowns, and the humanitarian and economic pains of 2020 are now firmly in the rear view mirror. So why are financial markets getting shaky and does this change our 2021 thesis?
It’s been the third worst start to the year for 10-year US Treasury bond returns in 190 years, only behind 1980 and 2009. In early 1980 the US Federal Reserve hiked interest rates by over 5% to a cycle peak of 20% in an attempt to rein in rampant consumer price inflation, which was running around 15% year-on-year in a very different world to what we live in today. In 2009, bond yields were rebounding with growth expectations after the 2008 Lehman Brothers default and Great Financial Recession, so arguably a more similar situation to what we are witnessing today after the Great Pandemic Recession.
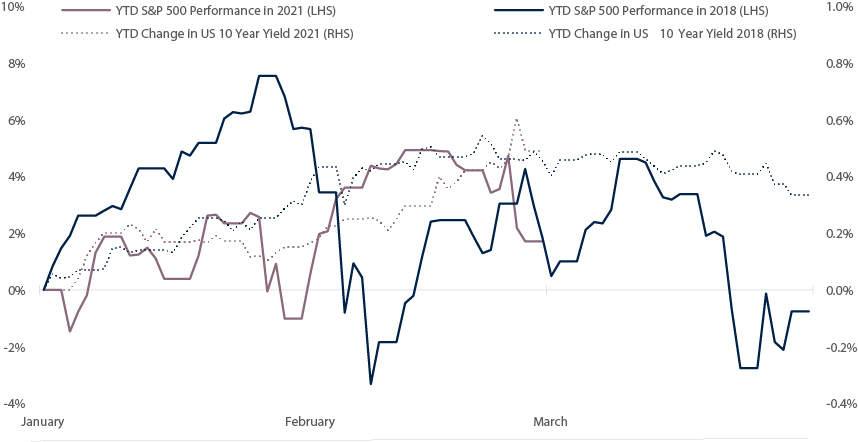
The Bloomberg Barclays US Treasury Total Return Index subsequently posted a loss of -3.6% in 2009. Today, at the end of February 2021, the same index is down -2.8% as the yield on the US 10-year treasury bond has risen sharply by 49 basis points year-to-date from 0.9% to 1.4%. Following its low point in August last year at 0.5%, it still has a little further to travel to get back to its pre-pandemic level of 1.9%, but most (two-thirds) of this ‘normalisation’ move has now been realised. However, it has been the persistent upward move in bond yields over this period, combined with the sharper move higher this year, that has eventually broken the camel’s back and taken the steam out of the latest equity market rally, causing the S&P 500 index to decline by -3.1% in the last few weeks of February.
More broadly speaking, it is actually the first quarter of 2018 that draws the most parallels to today. By the end of February 2018 the 10-year treasury bond yield had risen by 46 basis points year-to-date (roughly the same as this year) following the passing of Trump’s Tax Cuts and Jobs Act fiscal package at the end of 2017.
This caused growth and inflation expectations for 2018 to rise and put upward pressure on bond yields, not too dissimilar to this year with the soon-to-be passed Biden fiscal package, the American Rescue Plan Act, which is having similar effects on economic expectations. 2018 also followed a strong rally for equity markets in 2017 amidst a falling bond yield environment. However, in the first months of 2018 the S&P 500 index suffered a larger drawdown declining -10%, but subsequently went on to enjoy a robust summer rally.
Could the same happen this year? We think so, but we remain cautiously optimistic expecting further speed bumps along the road to recovery.

Source: Signia Wealth, Bloomberg. Data as at 28/02/2021.

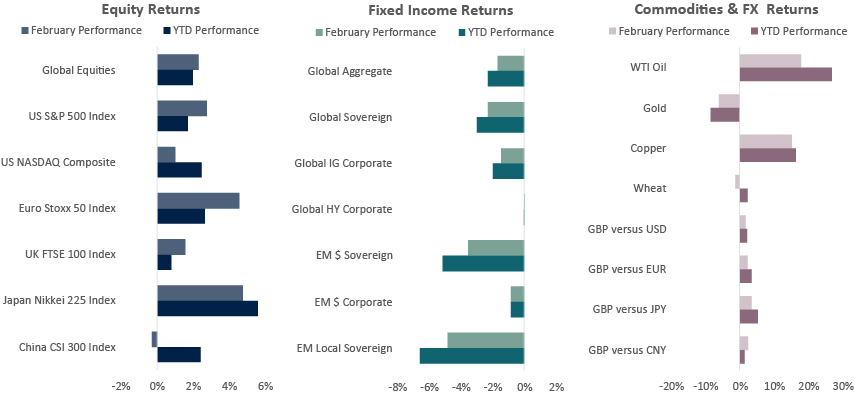
Source: Signia Wealth, Bloomberg. Data as at 28/02/2021. Global Equities: iShares MSCI ACWI ETF; Global Aggregate: Vanguard Global Bond Index GBP Hedged Fund; Global Sovereign: Xtrackers Global Government Bond GBP Hedged ETF; Global IG Corporate: Vanguard Global Corporate Bond Index GBP Hedged Fund; Global HY Corporate: iShares Global High Yield Corporate Bond GBP Hedged ETF; EM$ Sovereign: iShares J.P. Morgan USD EM Bond ETF; EM$ Corporate: iShares J.P. Morgan USD EM Corporate Bond ETF; EM Local Sovereign: iShares J.P. Morgan EM Local Government Bond ETF.
Equities
• Japanese and European equities delivered the best performance during February, as their higher cyclical content and lower exposure to technology companies helped returns.
• US equities also achieved a positive return for the month, though stocks in the technology sector underperformed due to their sensitivity to rising bond yields.
• UK markets posted a modest positive month, however Chinese equities were negative as profit-taking and tighter monetary policy weighed on sentiment.

Jack Rawcliffe
Fixed Income
• Fears of an overheating US economy as activity indicators pick up amid loose central bank monetary policy saw interest rates rise, hurting the global sovereign debt asset class in February.
• Global credit indices were mixed as investment grade corporate bonds were down on the month whereas high yield credit’s lower sensitivity to interest rate moves, strong oil prices, and investors’ continued hunt for yield helped shield the asset class from negative returns.
• Emerging Market Debt asset classes weren’t spared the negative effects of higher US interest rates as both hard currency and local currency sovereign indices fell substantially with the latter additionally suffering the effects of weaker EM FX.

Grégoire Sharma
Commodities & FX
• The 2021 rout continued for Gold as it declined for a second month, falling over 6% as a surge in real yields raised the opportunity cost of holding the non-yielding metal.
• Sterling climbed against a basket of its peers as a result of increased confidence in the UK and its impressive distribution of vaccines. GBP gained over 1.6% against USD and over 2.2% vs EUR.

Harry Elliman
World Economic Growth Rates (Real GDP)

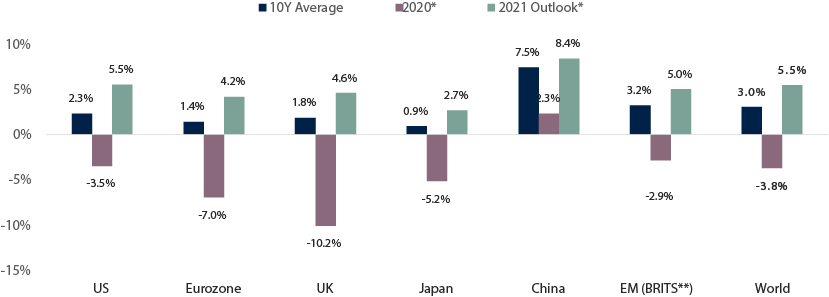
*Bloomberg Contributor Composite expectations. **Brazil, Russia, India, Taiwan, South Korea. Source: Signia Wealth, Bloomberg. Data as at 28/02/2021.
Choose a Service to Invest through
United States of America
The US economy rebounded quicker and stronger than expected in the second half of last year after its shortest sharpest recession in history, which saw the economy contract -10.4% in nominal terms during the first half of 2020. As coronavirus cases continue declining and the country’s vaccination programme progresses quickly, US retail sales have surged recently reflecting pent-up consumer demand and rising economic sentiment for Biden’s $1.9tn fiscal package.
Eurozone
Europe experienced one of the deeper economic recessions versus other regional economies and despite a bounce back in price levels in January, is set to battle deflation risks across the regional bloc this year. Second economic lockdowns are still largely in force as winter COVID-19 infections persist, further pressuring inflation expectations. However, with funds from the recently approved European Recovery Plan due for distribution to EU member states this year, and continued ECB stimulus support, hopes for higher economic growth in 2021 and beyond persist.
United Kingdom
The UK suffered a worse economic and humanitarian fate relative to the Eurozone after being slower to introduce Coronavirus containment measures that were amongst the strictest in Europe. This winter has seen stricter lockdowns reminiscent of the initial March 2020 lockdown. A No Deal Brexit on goods was avoided but excluded the predominant British services industry. Despite this, Brexit supply chain issues have materialised causing some inflation pressures.
Japan
Japan is exiting its third coronavirus wave that was significantly worse than its spring and late summer waves, which saw their Prime Minister declare a state of emergency in parts of the country. Japan has now started its vaccination programme as it waited for testing results from trials on its own domestic population. Despite substantial policy support, a vaccine-sceptic population may slow economic rebound potential in 2021 and beyond.
China
China was one of only two global economies that avoided an economic recession last year and expanded economic output beyond pre-pandemic levels in 2020 (the other country being Taiwan). Chinese GDP growth is expected to continue its solid path and rebound to its long-term historical growth rate of 8% this year. China’s new five-year economic plan elevates its self-reliance in technology into a national strategic pillar, most likely as a direct result of growing competitive tensions and trade wars with the US.
Emerging Markets
Emerging economies are beginning to recover from the Coronavirus crisis. Economic performance was mixed in 2020 but is expected to become more synchronised in 2021 as the global economic upswing and reflation policies takes hold, helping commodity prices to rise and support exporters such as Brazil, Russia and the UAE
Important Information
The information set out in this document has been provided for information purposes only and should not be construed as any type of solicitation, offer, or recommendation to acquire or dispose of any investment, engage in any transaction or make use of the services of Signia. Information about prior performance, while a useful tool in evaluating Signia’s investment activities is not indicative of future results and there can be no assurance that Signia will generate results comparable to those previously achieved. Any targeted returns set out in this document are provided as an indicator as to how your investments will be managed by Signia and are not intended to be viewed as a representation of likely performance returns. There can be no assurance that targeted returns will be realised. An estimate of the potential return from an investment is not a guarantee as to the quality of the investment or a representation as to the adequacy of the methodology for estimating returns. The information and opinions enclosed are subject to change without notice and should not be construed as research. No responsibility is accepted to any person for the consequences of any person placing reliance on the content of this document for any purpose. No action has been taken to permit the distribution of this document in any jurisdiction where any such action is required. Such distribution may be restricted in certain jurisdictions and, accordingly, this document does not constitute, and may not be used for the purposes of, an offer or solicitation to any person in any jurisdiction were such offer or solicitation is unlawful. Signia Wealth is authorised and regulated by the Financial Conduct Authority.

